
Trading Indicators
I developed these trading indicators to help me find entry and exit points on stocks, futures, and options. You can add these indicators to your chart also. Just select the trading indicator you want and follow the instructions to install it and add it to your chart. TradingView indicators are the easiest to install and use.
Stock Curry Day Trading Indicator
5 Minute Chart Reversal Indicator for Day Trading

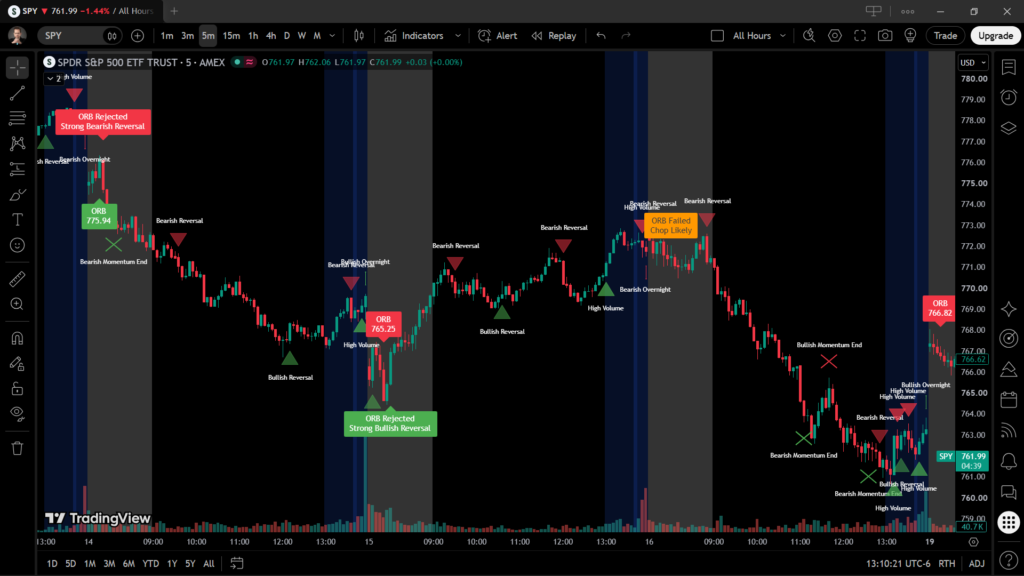
This indicator finds reversal patterns on the 5 minute chart. Best used with the 5 minute chart for day trading.
- Opening Range Breakouts (ORB)
- Candlestick Patterns (Reversal Indicators)
- High Volume Reversal Indicators
- High Volume Momentum Indicators
- EMA and VWAP Momentum Indicators
- Chop Indicators (Sideways Action)
- Overnight Direction Indicators
To successfully day trade with this indicator, follow these trading rules:
- Ignore flashes (indicators on candles that haven’t closed yet). Only trade an indicator after the candle has closed and the indicator has confirmed.
- Open new positions when the following occur (max 3 trades per day):
- ORB
- ORB Reversal
- First Reversal of the Day (so long as it occurs before noon)
- Trim at a Momentum End indicator.
- Close at the next reversal indicator.
- Don’t trade chop. If you see a Chop Likely warning, don’t trade anything until you see a clear breakout. The indicator can’t find breakouts yet, so you’ll have to chart those on your own.
To get this indicator, complete the following steps:
- Go to http://weprofit.io/tradingview and create a TradingView account, or sign in if you already have one.
- Click the link below to add this indicator to your chart.
Indicator is provided for informational purposes only. No guarantees of accuracy or success are made. Day trading carries a substantial risk of loss and is not suitable for every investor. Past performance does not guarantee future results. Your results may differ materially. Do your own research and only commit capital you can afford to lose.