Trading and Investing FAQ
Trading and Investing Frequently Asked Questions
These are the most common trading questions asked by students during training and coaching sessions.
Categories
Learning Resources
Free training is available on Stock Curry’s YouTube Channel. Additional training classes are available on the Free Lessons page.
Since the discord mainly provides trade alerts that you can copy and learn from, it’s best for you to understand how to trade options before joining the discord. The recommended learning path is to take the Fast Track to Trading Success Course first, and then join the discord after you’ve completed the Fast Track to Trading Success Course.
Fundamental Analysis
PE Ratios by Sector: https://finviz.com/groups.ashx?g=sector&v=120&o=pe
You need to calculate the Funds from Operations (FFO). To do that:
- Go to the annual Cash Flow Sheet, and Add Net Income + Depreciation. This is the annual FFO.
- Now multiple times 10 (for 10 years worth of value).
- Now discount that for the future value of money. I like to use 5% + inflation for a discount rate. Inflation should be the average inflation over the next 10 years, not the current inflation rate. In today’s environment, you might want to use 3% to 4% for the average inflation rate over the next 10 years, so a total 8% to 9% discount rate.
That is the fair value market cap for the stock.
Formula: ((Annual Net Income + Annual Depreciation) x 10) x (1 – Discount Rate) = Fair Value Market Cap
- Are they profitable? If yes, not a zombie stock. If no, see 2.
- On the balance sheet, scroll to the bottom and look at “Total Equities”. If the number negative? If yes, it’s a zombie stock. If no, see 3.
- On the income statement, look at “Net Income”. Divide Total Equities by Net Income. This gives you how many quarters of cash the company has left before they are bankrupt.
Technical Analysis
Scalping: 1 minute, 3 minute, 5 minute
Day Trading: 3 minute, 5 minute, 15 minute, 1 hour
Swing Trading: 1 hour, 4 hour, daily
Investing: 1 day, 1 week, 1 month
The shortest time frame on each is used for timing entries.
Point of Control Technical Indicator – The Volume Profile has a Point of Control level. POC is the price level at which the greatest number of contracts have been traded within a volume profile. A volume profile is a charting tool that displays the amount of volume traded and the overall trading activity at each specific price level during a given period. It acts like a support / resistance level. You can view the Volume Profile in Trading View and Think or Swim.
Opening Range Breakout. Day trading technical indicator. The opening range is the high and low for the first period of trading (the first candle on the chart). When a subsequent candle rises above the first candle’s high, this is called an opening range breakout, and is an indication that the stock might continue to rise. When a subsequent candle falls below the first candle’s low, this is also called an opening range breakout, and is an indication that the stock might continue to fall.
Day traders use either the first 5 minute candle or first 15 minute candle to determine the opening range. ORBs are used by day traders to trade the first 90 minutes of the day. 90% of the time, the market will reach the day’s high or low within the first 90 minutes of trading. After the first 90 minutes of trading, the market generally trades much flatter, making ORBs most useful in the first 90 minutes of trading.
Options
You need to expand the number of strikes you can see. Click the options settings button (visible when viewing options), then increase the number of strikes prices you can see. The default on many broker platforms is 10 or 20. You may need to increase this to 50 or All.
Most options only trade during regular market hours (9:30am – 4:00pm Eastern Time). There are a few exceptions that trade until 15 minutes after the close (4:15pm Eastern Time):
Market ETFs
- DIA – Dow Jones Industrial Average Index ETF
- DJX – Dow Jones Industrial Average 1/100 Index
- SPX – S&P 500 Index
- SPY – S&P 500 Index ETF
- XSP – Mini S&P 500 Index
- MDY – S&P Midcap 400 ETF
- OEX – S&P 100 Index
- OEF – S&P 100 Index ETF
- NDX – Nasdaq 100 Index
- QQQ – Nasdaq 100 Index ETF
- RUT – Russell 2000 Index
- MRUT – Mini Russell 2000 Index
- IWM – Russell 2000 Index ETF
- IWN – Russell 2000 Value ETF
- IWO – Russell 2000 Growth ETF
- IWV – Russell 3000 Index ETF
- EEM – Emerging Markets ETF
- EFA – Europe, Australia, Asia, and the Far East (EAFE) ETF
- XEO – Euro 100 Index
Volatility ETFs
- VIX – Volatility Index
- SVIX – Short VIX Futures ETF (-1X)
- SVXY – Short VIX Futures ETF (-1.5X)
- UVIX – Leveraged VIX Futures ETF (2X)
- UVXY – Short VIX Futures ETF (-1.5X)
- VIXM – VIX Mid-Term Futures ETF
- VIXY – VIX Short-Term Futures ETF
- VXX – VIX Short-Term Futures ETN
- VXZ – VIX Mid-Term Futures ETN
Sector ETFs
- KBE – Bank ETF
- KRE – Regional Bank ETF
- XHB – Homebuilders ETF
- XLB – Materials ETF
- XLC – Communications Services ETF
- XLE – Energy ETF
- XLF – Financial ETF
- XLI – Industrial ETF
- XLK – Technology ETF
- XLP – Consumer Staples ETF
- XLU – Utilities ETF
- XLV – Healthcare ETF
- XLY – Consumer Discretionary ETF
- XME – Metals and Mining ETF
- XRT – Retail ETF
Commodity ETFs
- DBA – Agriculture ETF
- DBB – Base Metals ETF
- DBC – Commodity Tracking ETF
- DBO – Oil ETF
- GAZ – Natural Gas ETF
- GLD – Gold ETF
- JJC – Copper ETF
- MOO – Agribusiness ETF
- OIL – Oil ETF
- SLX – Steel ETF
- UNG – Natural Gas ETF
- UUP – US Dollar ETF
BULLISH Sell the higher priced one, buy the lower priced one
- Put Credit Spread (PCS) -> Sell $750 PUT, Buy $745 PUT -> Results in a Sell to Open
- Call Debit Spread (CDS) -> Sell $750 CALL, Buy $745 CALL -> Results in a Buy to Open
BEARISH Buy the higher priced one, sell the lower priced one
- Put Debit Spread (PDS) -> Buy $750 PUT, Sell $745 PUT -> Results in a Buy to Open
- Call Credit Spread (CCS) -> Buy $750 CALL, Sell $745 CALL -> Results in a Sell to Open
If the whale option is one-sided, you don’t know the reason why the option was purchased. It might be a whale who’s very heavy long on a stock, and they want to purchase puts to hedge their position. Or it might be a hedge fund that’s very heavy short on a stock, and they want to purchase calls to hedge their position.
The best way to look at whale options trades is to look for multi-leg options trades (known as spreads). Those are done by options traders, and are not hedges. Those indicate a clear direction a whale is expecting a stock to go in, and those you can follow along with.
Call options can move the market in some rare cases, known as a gamma squeeze. This is where a lot of call options were purchased from Market Makers. Normally those call options expire worthless, so market makers don’t care; they just collect the premium. But sometimes a stock will rally so high, market makers know those call options will be exercised, so they are forced to buy shares in order to deliver to the customer when the option is exercised. As market makers buy shares, this pushes the price of the stock even higher, which forces market makers to buy even more shares, and the price of stock just keeps going higher and higher and higher until the open interest of the call options diminishes to the point where market makers no longer have to buy shares.
Trading
/ES – S&P 500 – ETFS: SPY (1X), UPRO (3X), SPXU (3X SHORT)
/NQ – NASDAQ – ETFS: QQQ (1X), TQQQ (3X), SQQQ (3X SHORT)
/YM– DOW JONES – ETFS: DIA (1X), UDOW (3X), SDOW (3X SHORT)
/RTY– Russel 2000 – ETFS: IWM (1X), TNA (3X), TZA (3X SHORT)
/GC – Gold – ETFS: GLD (1X), UGL (2X), GLL (2X SHORT)
/SI – Silver – ETFS: SLV (1X), AGQ (2X), ZSL (2X SHORT)
/GL– Oil – ETFS: USO (1X), UCO (2X), SCO (2X SHORT)
/ZS– Soybeans – ETFS: SOYB (1X)
/ZC– Corn – ETFS: CORN (1X)
/ZW– Wheat – ETFS: WEAT (1X)
/ZT – 2 Year Bond – ETFS: UTWO (1X)
/ZF – 5 Year Bond – ETFS: UFIV (1X)
/ZN – 10 Year Bond – ETFS: UTEN (1X), TYD (3X), TYO (3X SHORT)
/?? – 20 Year Bond – ETFS: UTWY and TLT (1X), TMF (3X), TMV (3X SHORT)
/ZB – 30 Year Bond – ETFS: UTHY (1X)
/ZQ – 30 Day Fed Funds Rate – ETFS: none
/BTC – Bitcoin – ETFS: BITO (1X) / FOREX: BTCUSD (1X)
A single-stock ETF is an ETF that provides leverage on a single stock. These can be used in lieu of options to take out long or short positions that are leveraged compared to buying just the stock.
- AAPL – ETFs: AAPU (1.5X), AAPD (1X SHORT)
- AMZN – ETFs: AMZU (1.5X), AMZD (1X SHORT)
- GOOGL – ETFs: GGLL (1.5X), GGLS (1X SHORT)
- MSFT – ETFs: MSFU (1.5X), MSFD (1X SHORT)
- TSLA – ETFs: TSLL (1.5X), TSLS (1X SHORT)
On the day trade alerts, you’ll see something like this:
TSLA – $770C > $ 763.90 $ 745P < $747.00
If the stock goes above the > price, that means to open a call at the strike price listed.
If the stock goes below the < price, that means to open a put at the strike price listed.
In the above example, if TSLA were to go above $763.90, you would open a 0 day or weekly call option at the $770 strike price. If TSLA were to go below $747.00, you would open a 0 day or weekly put option at the $745 strike price.
Regarding when to close the trade, you’ll want to look for a sign of a reversal, such as a 10 minute / 21 minute EMA cross over.
PLEASE ENSURE YOU HAVE A STRONG UNDERSTANDING OF TECHNICAL ANALYSIS BEFORE ATTEMPTING TO DAY TRADE
You can forget about your trade and just let your broker execute when either your stop-loss or take-profit price is reached. This is very helpful if you have a job, and aren’t able to look at the markets all day long.
Webull
On desktop, find your open position on the Account page. Then to the left of the “Close” button under Actions, click the 3 vertical dots. Then in the Close Position menu, select “Close by Stop Loss / Take Profit”.
On the Mobile App, find your open position on the Account page. Click the position you want to close. On the bottom left, click the “Sell to Close” to expand the menu. Then click “Take Profit/Stop Loss”.
Thinkorswim (Charles Schwab)
Let’s say you buy a stock at $50, and you want to set a trailing stop-loss at $1.00 and a take-profit price of $55.
- On the tab Monitor -> Position Statement, right click on the open position, and choose “Create closing order” and select Market (or MKT).
- It should pop up the trade tab.
- Under the Order Entry, on the Advanced Order drop down, change it from “Single Order” to “OCO”. OCO means “One-Cancels-Other”.
- Now right click on the market order and select “Create Duplicate Order”.
- Change the first order from “DAY” to “GTC”. GTC means Good-Till-Cancelled.
- Change the first order from “MARKET” to “LIMIT”.
- Set your take-profit price on the first order. In this example, choose $55.00.
- Change the second order from “DAY” to “GTC”.
- Change the second order from “MARKET” to “STOP” or “TRAILSTOP” depending upon if you want your stop-loss to be a set price, or a trailing price below the highest price. For this example of setting a trailing stop-loss at $1.00, choose “TRAILSTOP”.
- Change your stop-loss price on the second order. In this example, choose $1.00.
- Click “Confirm and Send” and you’re done.
Fidelity
Use this URL, but change “XXXXXXXXX” to the ID of your account: https://oltx.fidelity.com/ftgw/fbc/oftrade/conditionalInit?ACCOUNT=XXXXXXXXX&CURRENT_PAGE=ConditionalTrade&DEST_TRADE=Y
Paper Trading
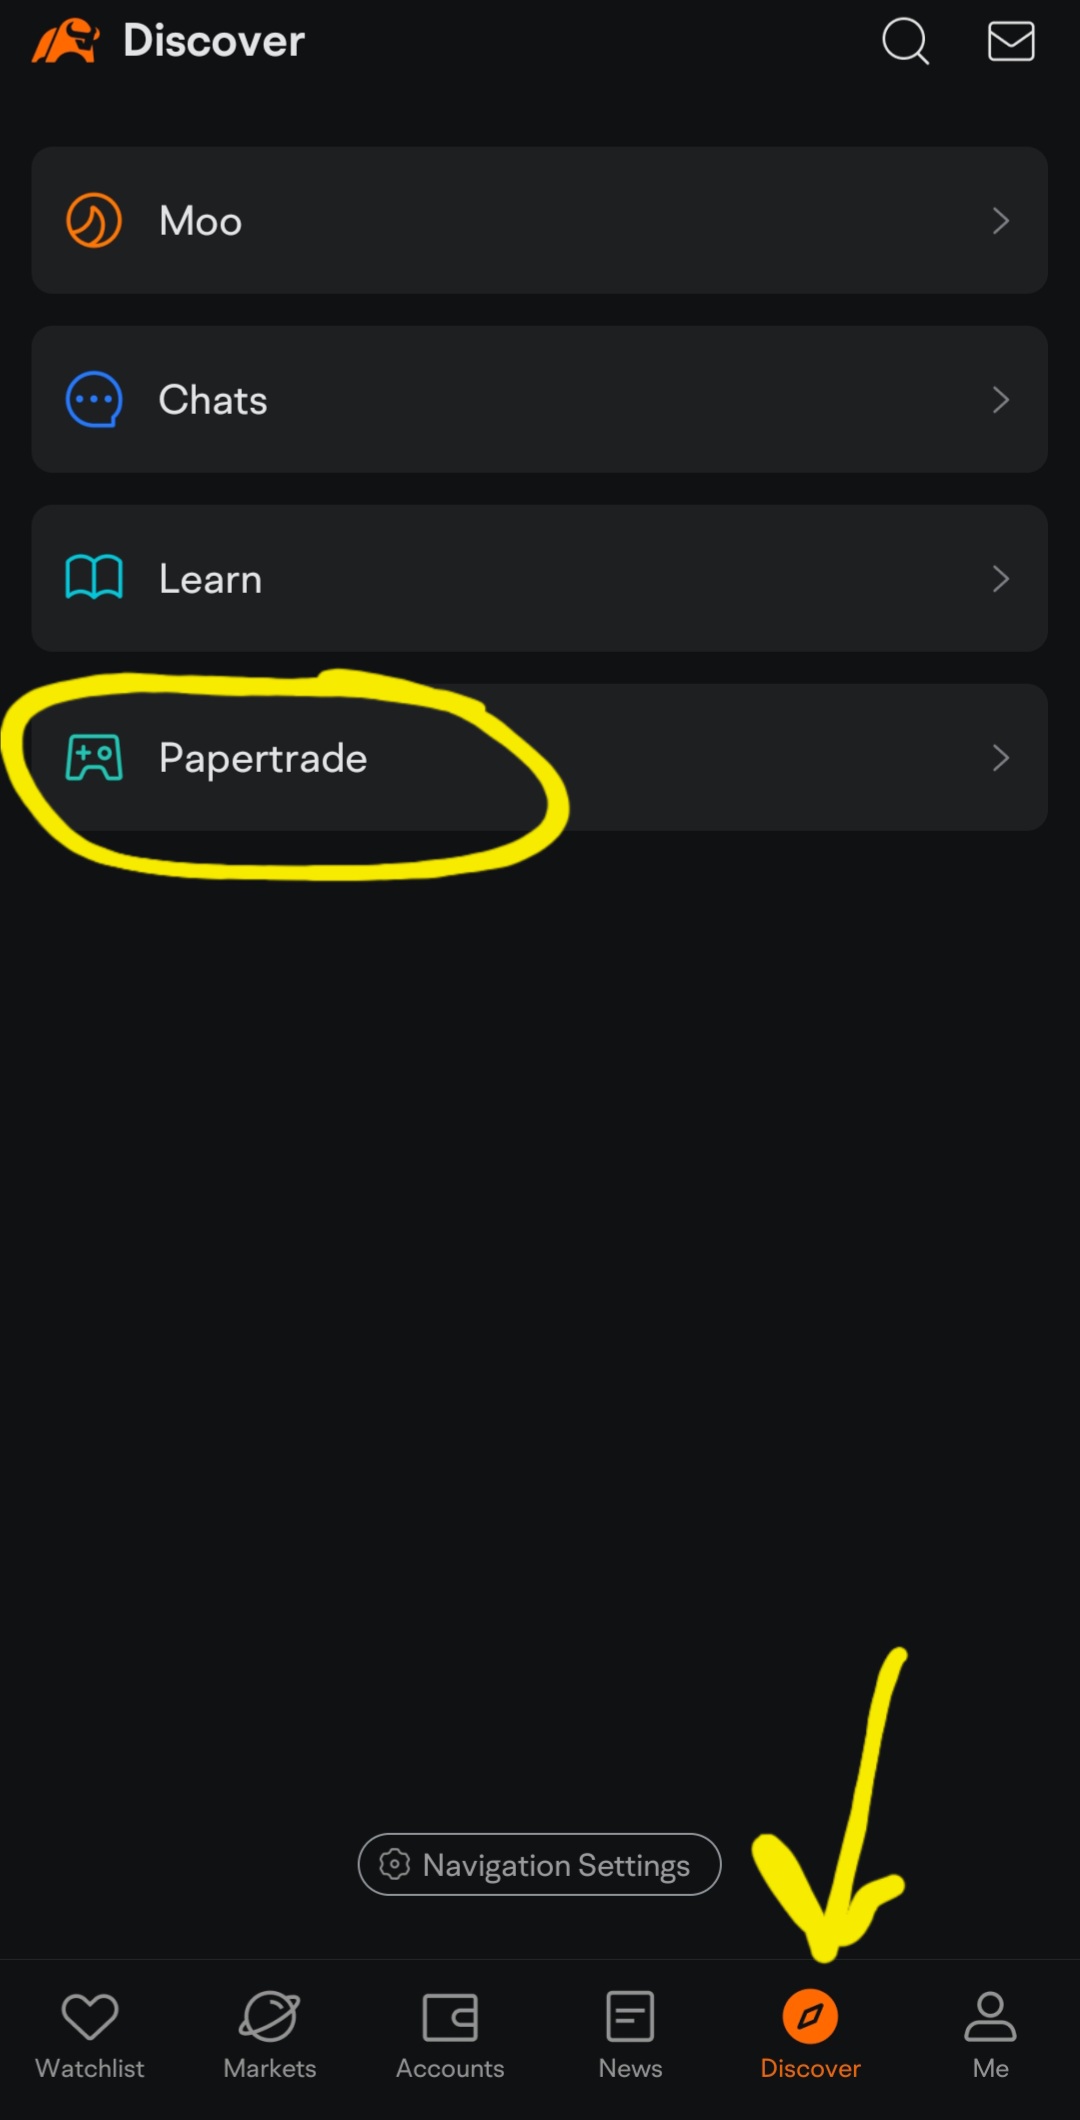
To paper trade on the Moomoo Android Mobile App, click on “Discover”, then click “Paper Trade”.
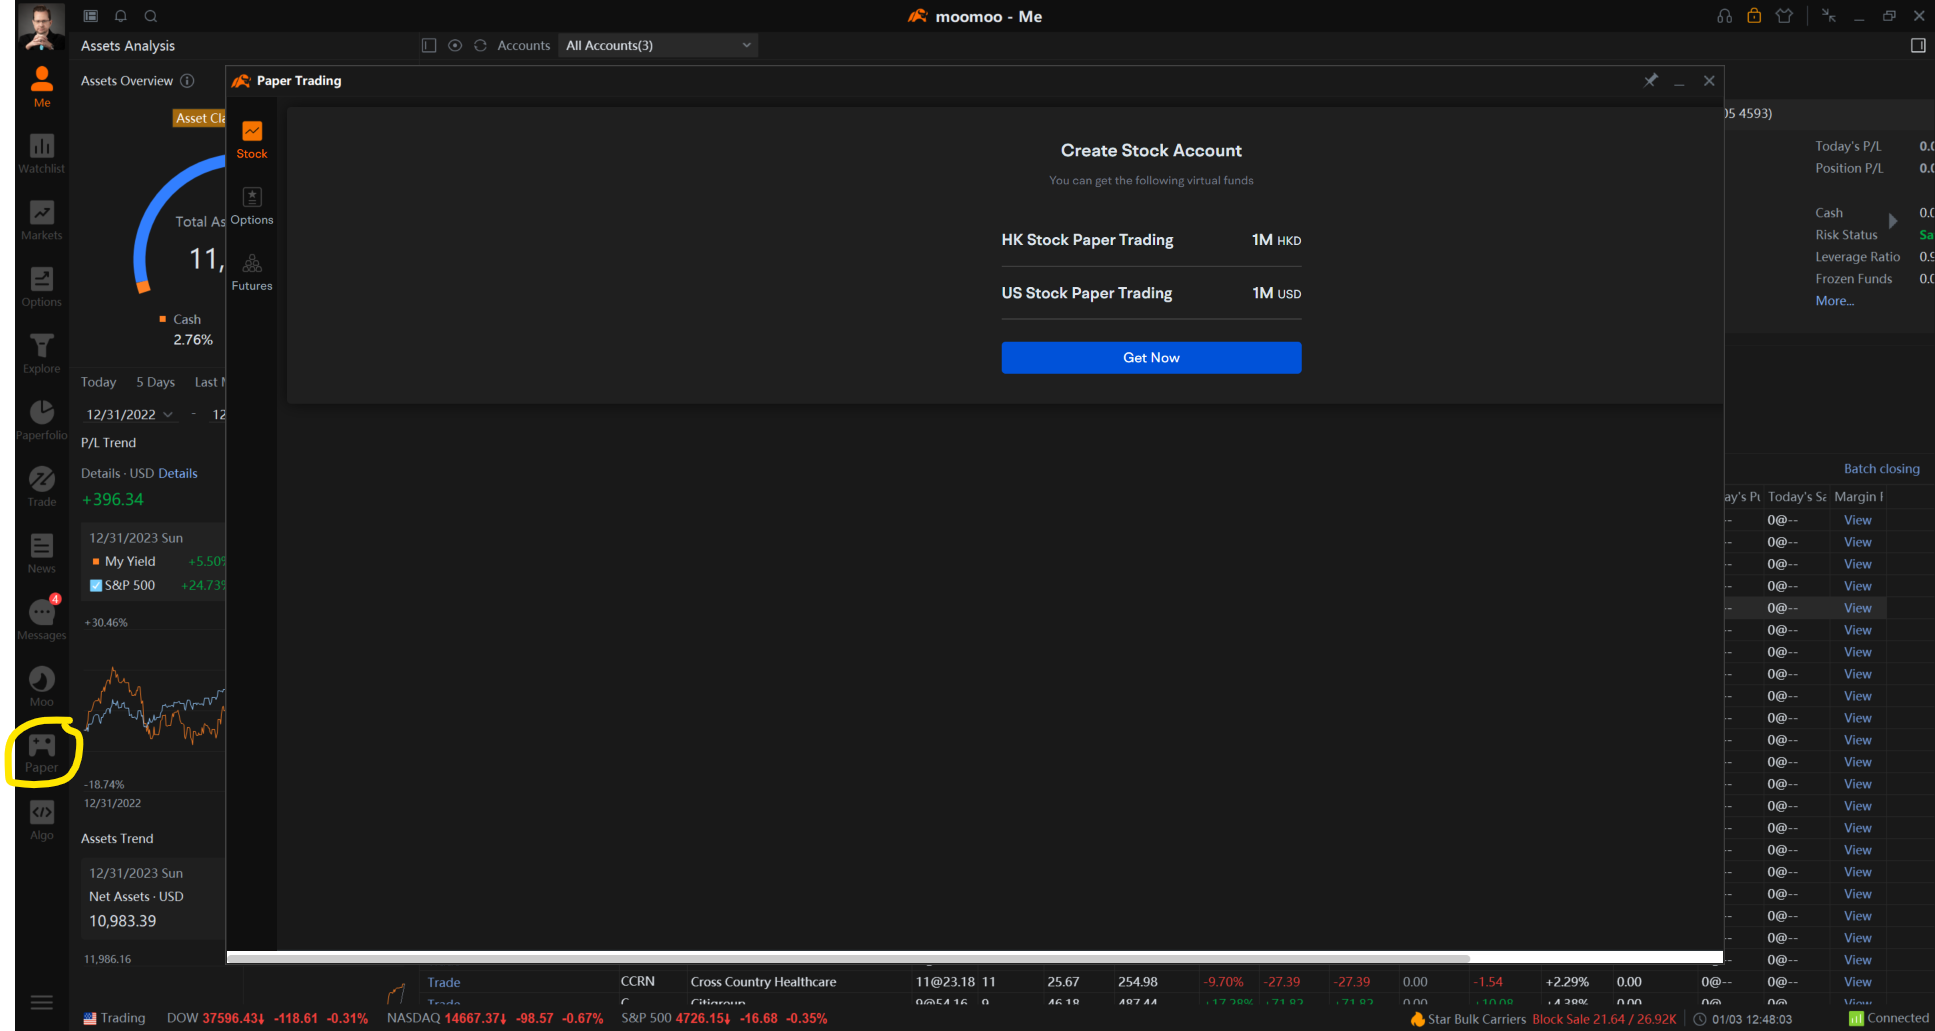
To paper trade on Webull Desktop, click the icon that looks like a stack of money.

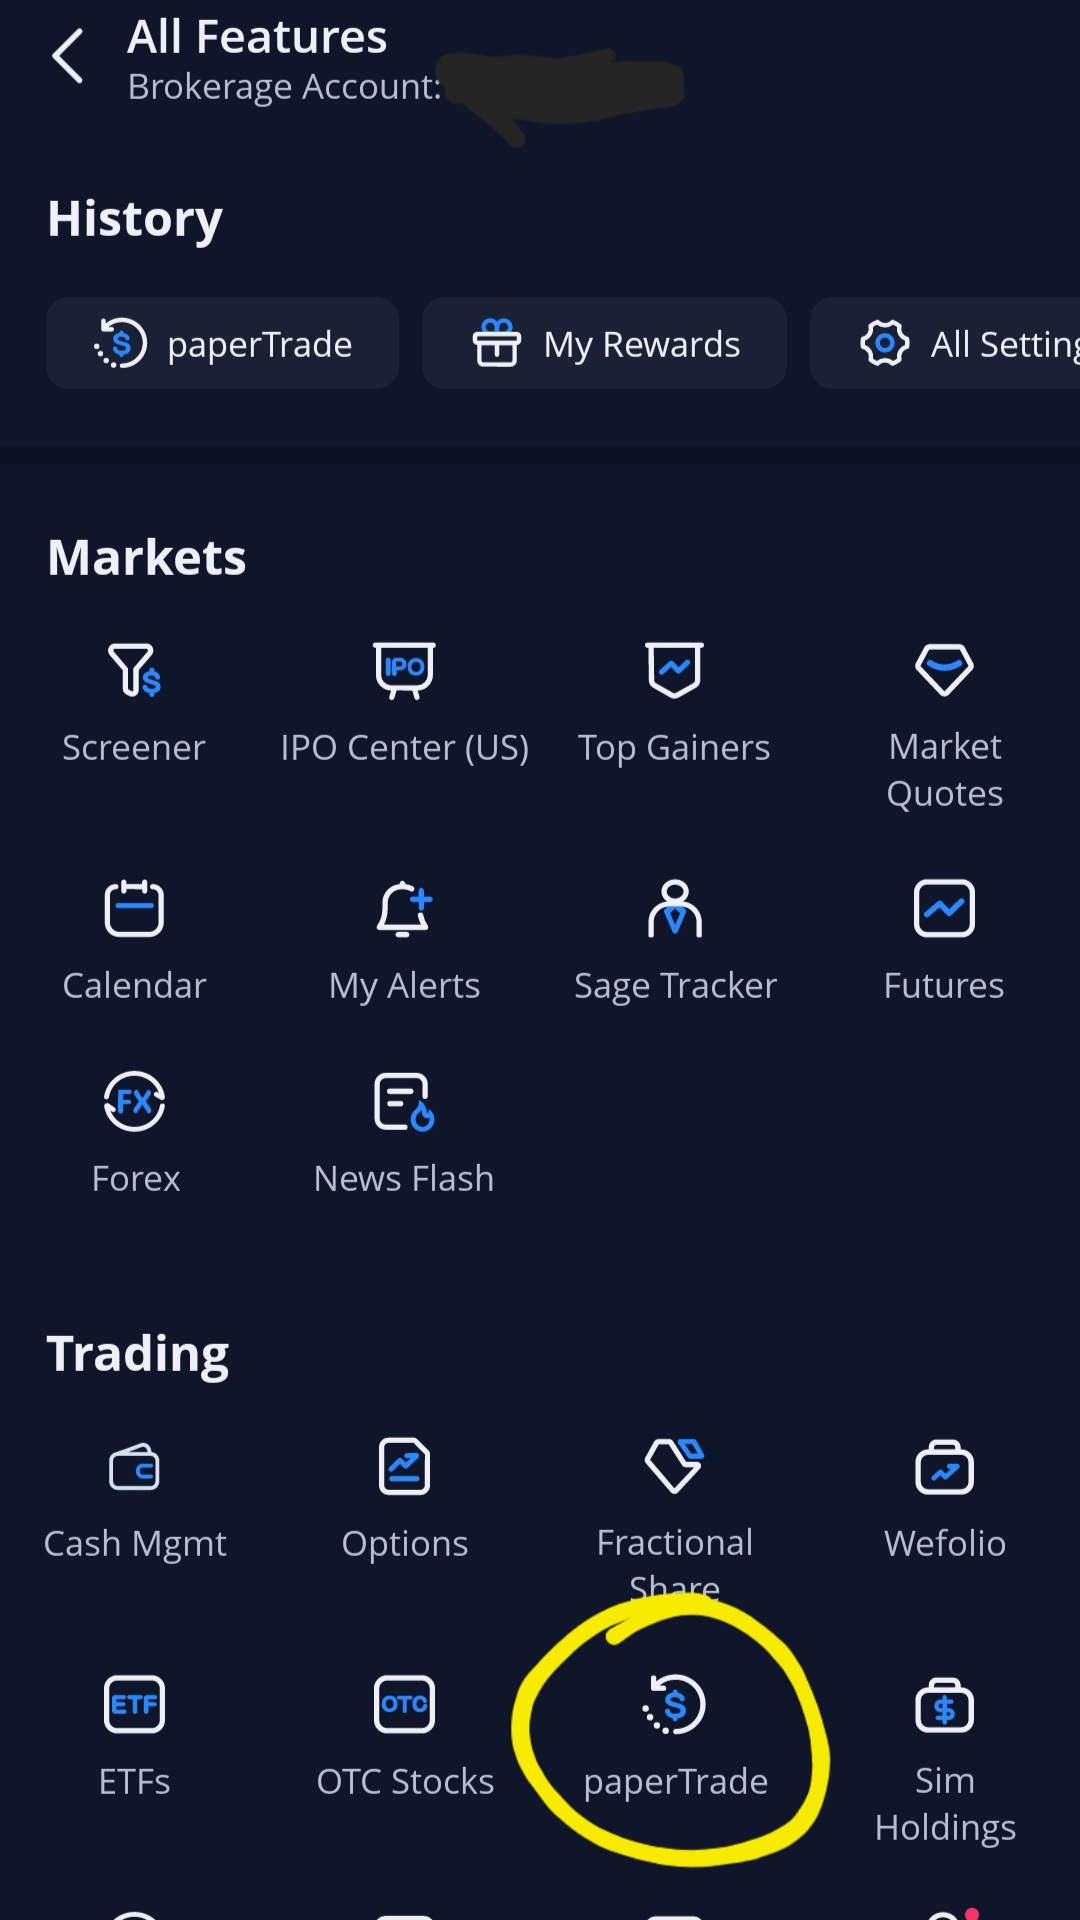
To paper trade on the Webull Mobile App, click on “Menu”, then under Shortcuts click “More”, then under Trading, click “paperTrade”.

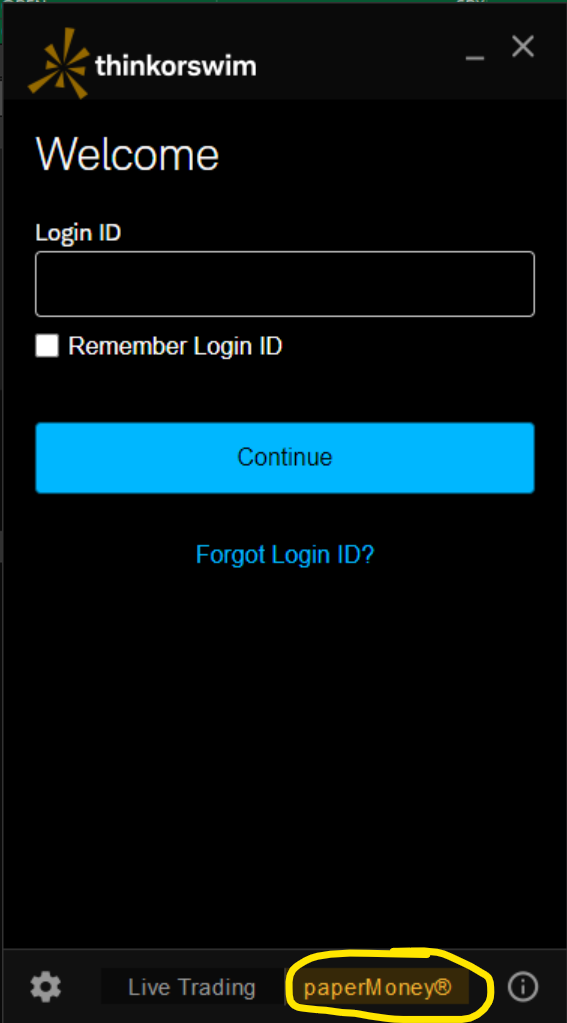
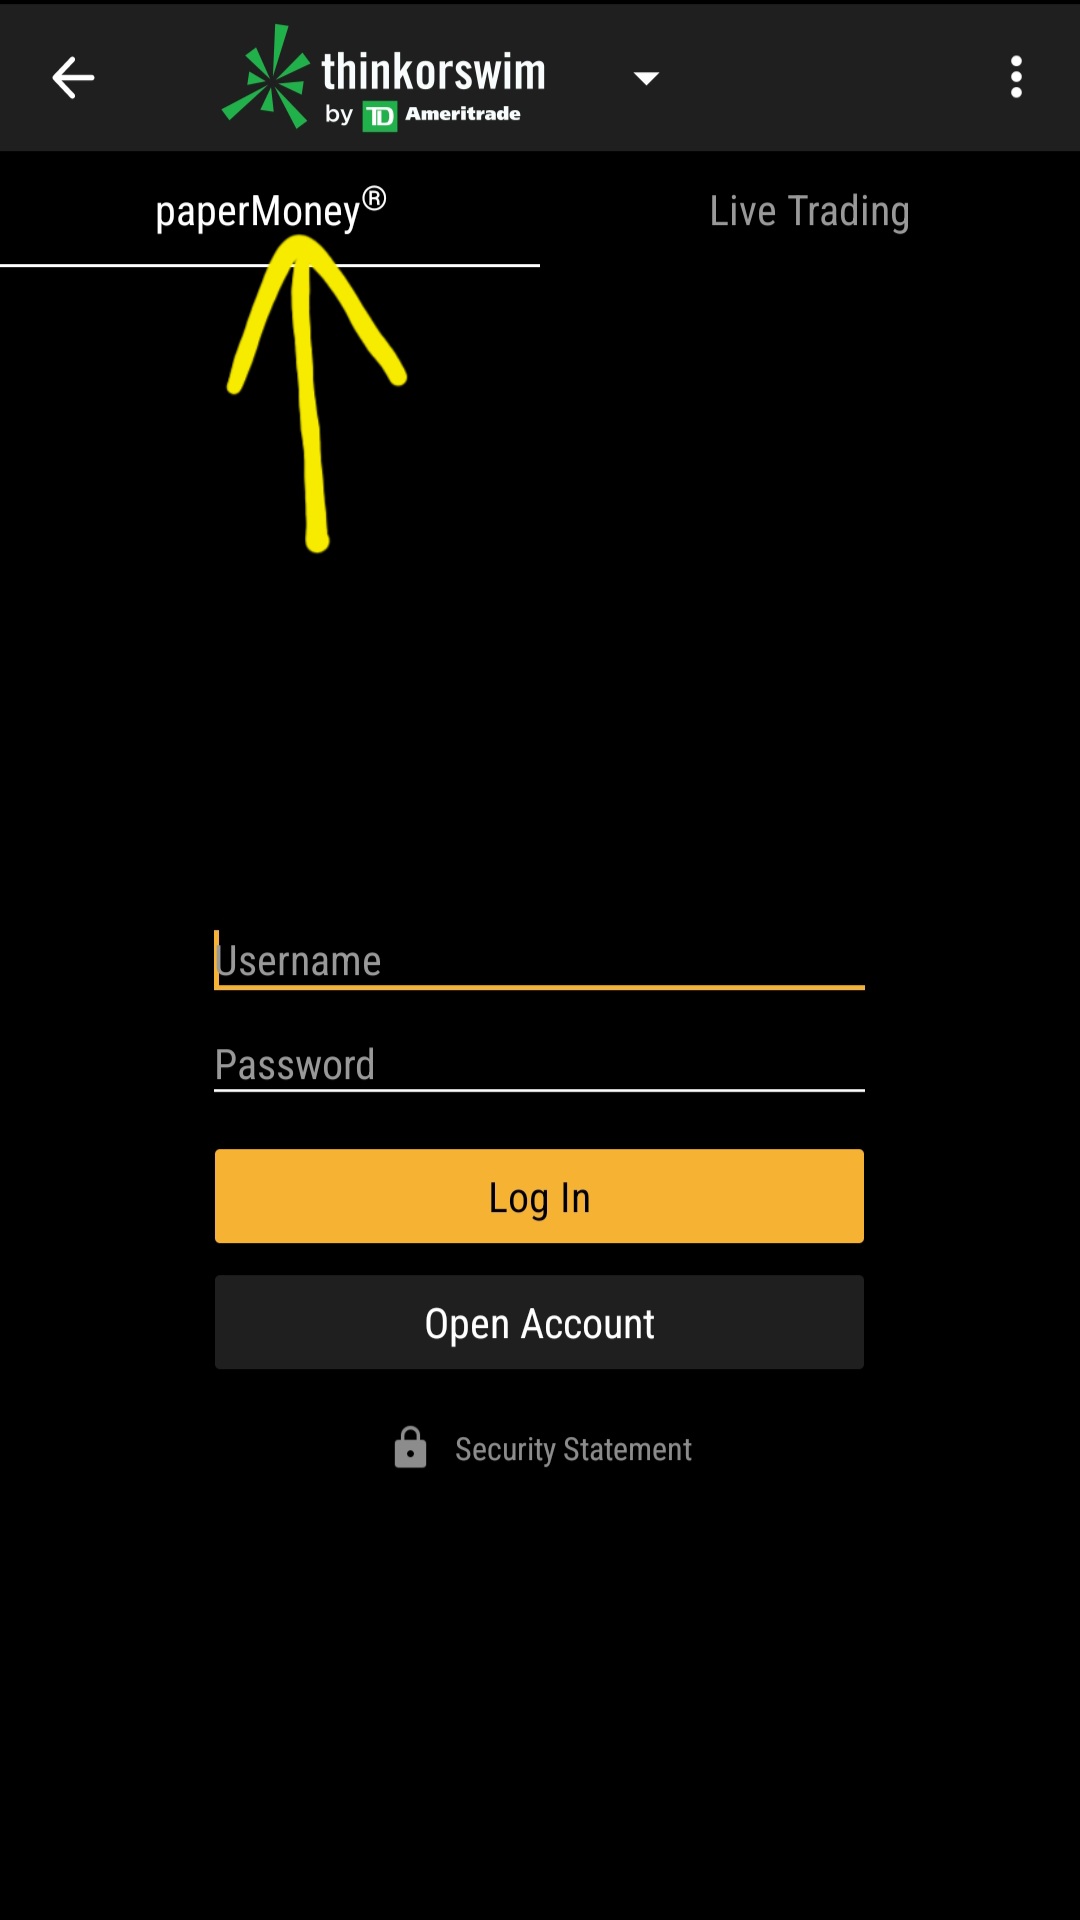
To paper trade on the Thinkorwim Mobile App, select “paperMoney” before logging in.
Taxes
Wash sale rules on options are not clear. The only clear wash sales are:
- you sell shares at a loss, and then either buy a call option or sell a put option on that stock within 30 days
- you sell an options contract at a loss, and then buy that exact same contract (same underlying, strike, and expiration date) within 30 days.
Outside of that, there are no clear rules on wash sales when it comes to options. Some brokers think different strike prices and contact dates on the same underlying security counts as a wash sale, while others say it does not. Each broker has their own rules as to whether or not a wash sale applies to options when you did not sell the underlying for a loss in the last 30 days. Neither the IRS nor Treasury Department has made the rules clear. Personally, I don’t count different strike prices and contract dates as wash sales, but your broker might.
Wash sale rules only apply to stocks and options. Wash sale rules do not apply to futures or FOREX. Crypto is FOREX, so wash sales rules do not apply to crypto either.