The similarities between 1987 and today are scary. And what is happening right now happened right before the 1987 market crash also. The stock market bubble is about to burst, and we could get a stock market crash in 2024. Before the 1987 crash, investor sentiment was bullish. Everybody was buying stocks, and the stock market had rallied over 40% in the first 7 months of 1987. Investors were oblivious to the fact that Black Monday was right around the corner. The economy is entering a recession in 2024 just like the economy was in 1987. Investors ignored all of the signs of rising inflation, possible higher interest rates, and economic slowdown in 1987, just like they’re ignoring the same warning signs today. And that’s why we could see a stock market crash in 2024, just like the 1987 stock market crash. Stock market investing will get more difficult, but it’s still possible to make money. I’ll show you how.
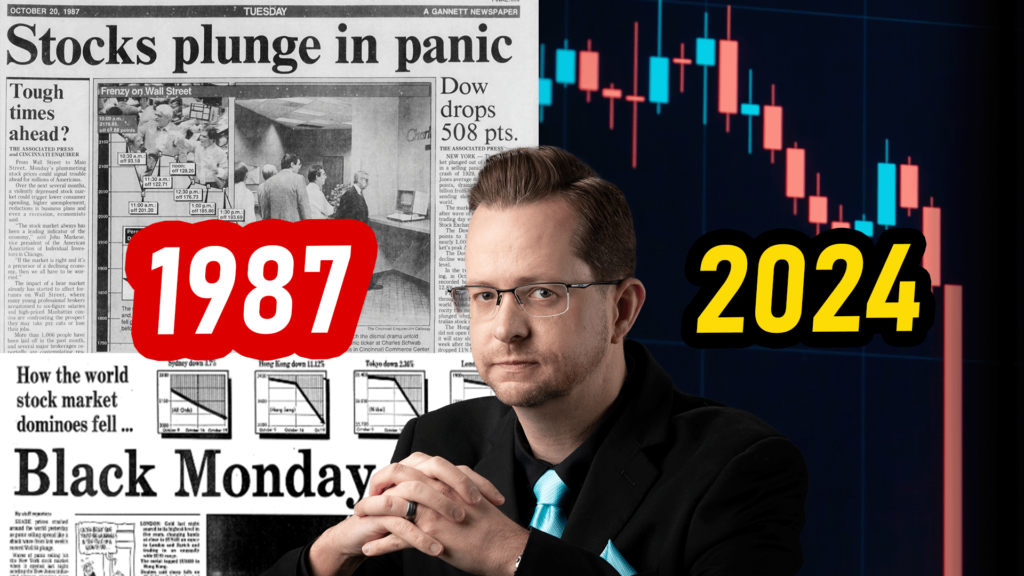
What is happening right now also happened right before the stock market crash in 1987. Much like today, nobody in 1987 expected the stock market to fall. Yet on October 19th, 1987, stocks plunged as investors panicked. The stock market fell 22.6% in a single day. It was known as the Black Monday stock market crash, and the crash was significantly worse than the 1929 stock market crash. And sadly, the market today is starting to look a lot like 1987. I’m Stock Curry. I’m a former Merrill Lynch and Morgan Stanley investment banker, and I’ve been trading for over 25 years. Let me show you what happened in the events leading up to the 1987 stock market crash, then let me show you how those events compare to today. And then at the end of the video, I’m going to show you how you can protect your portfolio from a potential downfall in the market, as well as potentially even make money off of a stock market crash.
Let’s start with the events leading up to the 1987 stock market crash. Earlier in the year, the stock market had raced upward during the first half of 1987. By late August, the Dow Jones had gained 44% in a matter of seven months, stoking concerns of an asset bubble. This is very similar to the rally that we’ve seen in the Dow Jones over the past six months. Even more shocking was the rally in the Nasdaq over the past six months. In both 1987 and today, the stock market had experienced a massive rally in a very short period of time. But there were some economic events that caused things to start to change in October of 1987.
In mid-October 1987, a storm cloud of news reports undermined investor confidence and led to additional volatility in the markets. The federal government disclosed a larger than expected trade deficit, and the dollar fell in value. The markets began to unravel foreshadowing the record losses that would develop a week later. Over the past few weeks, we’ve seen the stock market start to sell off, with April showing a decline for the Dow Jones. Even though the stock market did start to sell off during the past few weeks, it rallied last week, and this shows that investors remain quite confident and quite bullish. And the sell off may have been nothing more than a foreshadow of what’s to come. It’s highly unlikely we’ve actually seen the sell off that investors are now predicting.
Last week, the S&P 500 posted its best week since November as the Nasdaq surged 2%. The rally in stocks has mostly come from the tech sector, as Alphabet was up 10% on Friday, Amazon was up 3%, Nvidia was up 6%, and Microsoft was up nearly 2% as well. The stock market ultimately looks at earnings, and most importantly, forward earnings growth, in order to determine whether to buy stocks or sell them. And the earnings so far, especially from tech stocks, have come out quite good. But as we’ve seen in the past, tech stock rallies can unravel quite quickly, just like they did in 2001 and 2002, once investors realize that the growth that they are expecting is no longer sustainable.
And unfortunately, a slowdown in growth is exactly what we’re seeing. The GDP growth slowed to a mere 1.6% in the first quarter, which was well below expectations. Most concerning is the fact that consumer spending increased only 2.5% in the period, down from 3.3% in the fourth quarter, and well below Wall Street’s estimate of 3%. Consumer spending makes up 60% of the economy. So when consumer spending starts to slow down, this is really bad news for the economy. Of course, there are two reasons why consumer spending is starting to slow down, and why it might even turn negative soon.
Massive consumer spending has been possible due to debt. Consumers have been going deeper and deeper into debt, and the consumer debt is now at the highest level it has been in the history of the United States. At the same time, consumer savings are being depleted as consumers burn through their savings in order to continue to spend. Unfortunately, now the consumer savings rate is near the lowest level it has been, and right back to the level it was right before the 2008 Great Financial Crisis. And all of this consumer debt, as well as government debt, is very concerning, not only for the US economy, but the global economy as well. The World Economic Forum president said, “We haven’t seen this kind of debt since the Napoleonic Wars.”
Borge Brende, president of the World Economic Forum, gave a stark outlook for the global economy. He warned that the global debt ratios are close to levels not seen since the 1820s. And there was a stagflation risk for advanced economies. The global growth estimate this year is around 3.2%. While it’s not bad, it’s not what we’re used to. The trend growth used to be 4% for decades. And he added that there was a risk of a slowdown like that seen in the 1970s in some major economies. His warnings chimed with a recent report from the International Monetary Fund, which noted that global public debt had edged up to 93% of GDP last year. The IMF projected that global public debt could near 100% of GDP by the end of the decade. The fund also singled out the high debt levels in China and the United States.
Many economists have been warning that stagflation might be setting in, and now the World Economic Forum is saying the same exact thing. So what is stagflation and why is it so bad? Stagflation is the simultaneous appearance in an economy of slow growth, high unemployment, and rising prices. The problem with stagflation is that stagflation means that the economy is slowing down at the same time that inflation is going up. And the problem with that is the Federal Reserve, as they try to fight inflation, the way they fight inflation is by increasing interest rates. But when they increase interest rates, it slows down the economy. Now the Federal Reserve can also try to stimulate the economy. The way they do that is by lowering interest rates. The problem with lowering interest rates in order to stimulate the economy is that it causes inflation to go up.
So what does the Federal Reserve do when the economy is slowing down and they need to lower interest rates in order to stimulate the economy, but at the exact same time inflation is going up and the Federal Reserve needs to increase interest rates in order to get inflation down? The Federal Reserve is screwed. If they lower interest rates in order to get the economy going once again, then inflation is going to go out of control. And if they raise interest rates in order to get inflation down, then the economy, which is already slowing down, ends up going into a deep recession.
And keep in mind that stagflation is the combination of three things at the same time: a slowdown in economic growth, high unemployment, and rising prices. We’re already seeing a slowdown in economic growth, as GDP for Q1 came in at a measly 1.6%. And over the past year and a half, the unemployment rate, while still historically low, has been rising. And unfortunately, inflation continues to go up as well. The key Fed inflation measure, the PCE, or personal consumption expenditures price index, rose 2.8% in March, which was much more than expected. The month over month inflation rate has been rising every single month since October. So when we look at the requirements for the stagflation definition, we now meet all three. We have a slowdown in economic growth, we have unemployment rising, and we have rising prices in the form of inflation.
It’s now safe to say that stagflation is here. Now whether or not the Federal Reserve, or especially President Biden, is going to admit that or not, is well, highly unlikely. But the reality is the data shows we have stagflation, just like we had during the 1970s leading up to the 1987 stock market crash. And unfortunately, all of the data so far shows that inflation is not going away. And this is going to make things very difficult for the Federal Reserve. It means the Fed is not going to be cutting rates. And if inflation does not come down, the Fed is either going to have to hike again at some point, or they’re going to have to keep rates higher for longer. The question is, does that ultimately give us the hard landing scenario? A hard landing is a recession. We will hear from the Federal Reserve on Wednesday at 2 p.m. Eastern Time, when they give us their interest rate decision, and we will hear more at 2:30 p.m. Eastern on Wednesday when Jerome Powell gives us press conference.
So that’s what’s happening today. But why does the market look a lot like 1987? Well, during the years prior to the 1987 crash, equity markets had been posting strong gains. Price increases outpaced earnings growth and lifted the price to earnings ratio on stocks. Some commentators warned that the market had become overvalued. And if we look at the PE ratios today compared to 1987, you can see that the PE ratios today are even higher than they were in 1987. Just like today, during the months leading up to the 1987 crash, a growing US trade deficit and a decline in the value of the dollar were leading to concerns about inflation and the need for higher interest rates in the US.
In addition to that, there was something else new in 1987 that caused that crash to be so much worse than the 1929 stock market crash. In 1987, financial markets had seen an increase in the use of programmed trading, or algo trading, where computers were set up to quickly trade particular amounts of large numbers of stocks. And today the algo trading market size is much larger than it was in 1987, and it continues to grow. In 1987, we had equity markets rallying just like they are today. We had the US economy slowing down just like we have today. We had inflation rising just like we have today. We had concerns about the Fed might having to raise interest rates again, just like we have today. And all of this means that investors are too complacent, as the stock market could be headed for a sharp reversal this year.
Investors are getting too complacent about the strength of the stock market, and their unabashed bullishness could hit a wall, as a big selloff is not out of the question this year. That’s according to the investing legend Robert Prechter, the founder of Elliott Wave International, who became famous for calling the 1987 stock market crash known as Black Monday. The market veteran says he’s eyeballing a potential plunge this year and warns that investors have become too comfortable. Prechter said in an interview with Fox Business Network on Monday that the market landscape resembles the years leading up to the 1929 crash. “The market has been complacent for years. It’s held up a long time, but this is the thinnest market I’ve ever seen on the upside,” Prechter said. When asked if a correction of 30% was possible, he replied that a drop of that magnitude would not surprise him.
So what can you do about a potential upcoming stock market crash or correction? While many top strategists see echoes of the 1987 stock market crash in today’s stock market, it is not true that all you can do is brace yourself and hope for the best. In my discord, we have been making money on every single drop in the market. Both HavClan and .redddd made a 100% profit on SPX vertical credit spreads, with .redddd making a $6,000 profit on his spread. And kleem just straight up bought put options on SPY and made a $2,000 profit on his put options, while another trader made a 1,500% profit on some SPX put options.
I myself made a 1,330% profit on SPX when it plunged a few weeks ago. That trade resulted in an $11,000 profit for me in a single day. If you want to potentially make profits like this in your portfolio also, then come join us in my discord where we are making money no matter whether the market goes up or down. If you want to potentially make a 1,000% profit or more in your portfolio also, then come join us in the discord.